

10 Ways Power BI Consulting Services Revolutionize Business Analytics
Section
Table of Contents
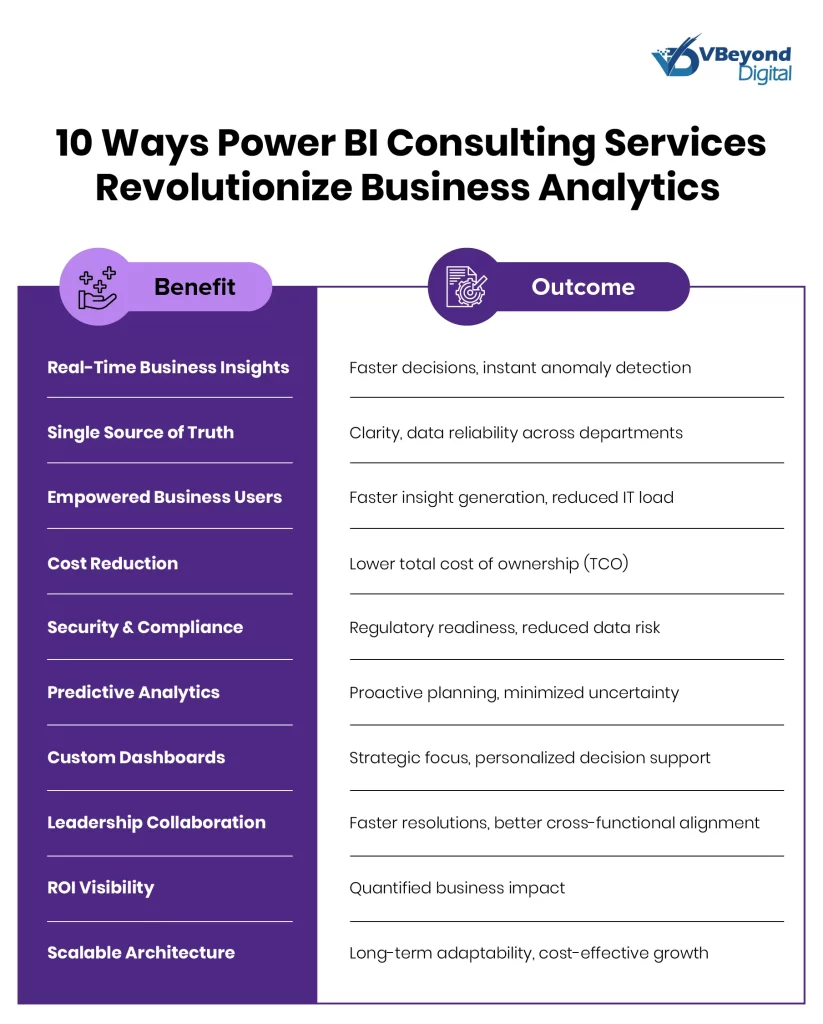
- Immediate Access to Real-Time Business Insights
- Creation of a Single Source of Truth
- Empowerment of Business Users Without Heavy IT Dependency
- Reduction of Costs Associated with Traditional Analytics
- Enhanced Security and Compliance Measures
- Predictive Analytics for Strategic Decision-Making
- Customized Dashboards Aligned Directly with Executive Goals
- Improved Collaboration Across Leadership Teams
- Measurable Return on Investment (ROI) in Analytics
- Scalable Solutions That Grow with Your Business
- Conclusion
- FAQs ( Frequently Asked Questions)
- Power BI consulting helps enterprises build dynamic dashboards that consolidate data from multiple sources, providing a single source of truth for agile, informed decision-making.
- By reducing dependency on IT for routine reporting, these services empower business users with self-service analytics, fostering quicker problem resolution and smoother collaboration across teams.
- Shifting from traditional analytics to scalable, cloud-based solutions cuts licensing, hardware, and maintenance costs, while integrated security protocols ensure compliance and data protection.
Dive into our comprehensive blog post where we outline 10 actionable ways to transform traditional business analytics through innovative tools and techniques. From enhanced data visualization to improved operational efficiency, this guide details how expert support—with power bi consulting services—can unlock new opportunities for growth and drive strategic success.
Microsoft Power BI is a business intelligence solution that equips executives with actionable insights needed for critical decision-making. Designed to integrate with various data systems, Power BI supports leaders in monitoring key performance indicators with precision and accuracy. As organizations encounter challenges such as fragmented data, delayed reporting, and integration complexities, specialized Power BI consulting services offer a clear solution. Rather than attempting an independent implementation, many enterprises engage experts who provide tailored strategies that align with specific business goals.
Consultants bring deep expertise in merging diverse data sources, configuring dynamic dashboards, and maintaining data consistency. This proficiency has driven a notable increase in adoption among major global corporations, with a rising number of Fortune 500 companies choosing Power BI to improve data visibility and operational agility. Accurate, timely data analysis directly supports decision-making processes, reducing risks and directing focused resource allocation for senior IT leaders and digital strategists.
By investing in expert Power BI consulting, organizations position themselves to respond promptly to both market changes and internal operational demands, paving the way for well-informed decisions that produce tangible business outcomes.
1. Immediate Access to Real-Time Business Insights
Consultants integrate live data streams to create dynamic dashboards that provide a current view of critical business metrics such as sales figures, operational performance, and service KPIs. By connecting multiple data sources into one unified reporting framework, expert teams reduce delays that occur with periodic reporting methods. This approach gives executive teams a continuous pulse on operations, enabling rapid detection of anomalies and prompt corrective measures.
At VBeyond Digital, we design systems that aggregate real-time data, delivering updated insights that allow leadership to monitor performance continuously. This direct access to current information supports precise decision-making and more accurate planning. With the ability to observe live data, organizations can address deviations as soon as they occur, significantly cutting response times. The outcome is a more agile decision-making process that not only mitigates risk but also contributes to a clearer understanding of overall business performance.
2. Creation of a Single Source of Truth
In many organizations, multiple systems and departmental reports lead to conflicting data, making it difficult for executives to reach clear conclusions. Expert Power BI consultants address this issue by consolidating all relevant data into one unified platform. This central repository becomes the single reference point for all key metrics, allowing senior leaders to base decisions on consistent and verified information.
Key advantages include:
- Data Consolidation: Integrating various data streams into one central dashboard eliminates conflicting reports.
- Consistency: A uniform set of metrics across all departments reduces uncertainty and supports clearer strategic decisions.
- Improved Governance: Standardized data supports better internal audits and regulatory reviews.
- Enhanced Clarity: With one accurate source, executives gain confidence in the integrity of their operational data.
3. Empowerment of Business Users Without Heavy IT Dependency
Consultants develop interfaces that prioritize clarity and ease of use, enabling non-technical senior management to work directly with their data. By crafting dashboards and reporting tools that speak the language of business, expert teams make it possible for executives to extract insights without needing repeated IT intervention. This approach not only speeds up decision-making but also reduces the burden on technical teams, freeing them to concentrate on more complex challenges.
Key aspects include:
- User-Centric Design: Interfaces are created with an emphasis on simplicity and intuitive navigation, ensuring that business users can access and interpret data without extensive training.
- Self-Service Analytics: By allowing marketing, finance, and operational leaders to independently query and analyze data, organizations eliminate delays that occur when waiting for IT to generate reports or perform modifications.
- Customizable Visual Tools: Dashboards feature adjustable metrics and interactive charts that allow executives to tailor their view according to immediate business questions. This flexibility supports quick adjustments in strategy based on observed trends.
- Reduced IT Backlog: With direct access to analytical tools, the dependency on IT teams for routine report generation is minimized. This not only cuts down on turnaround times but also lets IT professionals focus on strategic system improvements.
- Rapid Insight Generation: Intuitive interfaces provide clear visual summaries, enabling leadership to identify trends, spot anomalies, and take action promptly. This direct line to data supports faster resolution of issues and more agile planning.
4. Reduction of Costs Associated with Traditional Analytics
Traditional analytics systems typically incur high operational expenses due to licensing fees, hardware investments, and ongoing maintenance. Many organizations face the challenge of outdated methods that demand constant manual interventions and frequent system upgrades. Engaging expert Power BI consulting services provides a direct path to reducing these expenses by shifting to a more cost-effective, cloud-based solution that centralizes data management.
Key cost-saving factors include:
- Lower Licensing Fees: Modern subscriptions often come with reduced costs compared to legacy systems, resulting in noticeable savings on software expenses.
- Reduced Hardware Investments: Transitioning to cloud-based data storage and processing diminishes the need for significant physical infrastructure investments, cutting down on capital expenditures.
- Decreased IT Overhead: With self-service reporting and intuitive dashboards, IT teams are relieved from routine data compilation tasks. This shift allows them to concentrate on strategic initiatives that drive business value.
- Resource Consolidation: Centralizing data from multiple sources into one platform minimizes redundancy. This consolidation simplifies management and lowers the overall costs tied to maintaining several disparate systems.
- Lower Maintenance and Support Expenses: Expert consulting services include regular system updates and proactive monitoring. This continuous support reduces downtime and mitigates the expense associated with emergency fixes.
5. Enhanced Security and Compliance Measures
Power BI consulting services set up advanced security protocols and strict access controls to safeguard critical business information. By designing security systems that guard against internal and external risks, consultants help organizations manage sensitive data with high reliability. Their approach involves integrating security measures into every layer of the data environment, from user access to data storage, while also addressing strict regulatory requirements.
Key components include:
- Role-Based Access Controls:
Consultants configure systems so that only designated personnel have permission to view or modify specific data sets. This control minimizes the risk of unauthorized access and accidental data exposure. - Data Protection Protocols:
Advanced encryption methods are applied both during data transmission and while data is stored. These measures help prevent breaches and safeguard confidential information. - Regular Auditing and Monitoring:
Continuous monitoring tools and periodic security audits are implemented to detect any anomalies or potential breaches. Detailed logging supports quick investigation and accountability. - Regulatory Compliance:
Systems are designed to meet regulatory standards such as GDPR, HIPAA, and other data protection laws. Structured reporting and documentation make compliance audits straightforward and less time-consuming. - Incident Response Planning:
Consulting teams set up protocols that define clear steps for addressing any security incidents. Training sessions for IT and security personnel help ensure prompt and effective responses to potential threats.
6. Predictive Analytics for Strategic Decision-Making
Expert consultants incorporate predictive analytics to offer executives data-based forecasts that reduce uncertainty in planning and risk management. By integrating historical data with advanced statistical models and machine learning algorithms, these professionals build systems that reveal trends in market demand, customer behavior, and operational performance. This capability allows leadership to act on potential changes before they become significant issues, guiding decisions such as budget adjustments, targeted marketing strategies, or shifts in production focus.
Consultants work to create predictive systems through careful integration of data and rigorous model testing. The process typically involves:
- Data Integration and Cleansing: Combining data from multiple sources and refining it to remove inconsistencies lays the groundwork for accurate forecasts. This step is critical to ensuring that all analyses are based on verified and unified information.
- Statistical and Machine Learning Techniques: Various methods such as regression analysis, decision trees, and time-series forecasting are employed to identify patterns and predict upcoming shifts. These techniques help in forecasting customer churn rates, sales trends, and other key performance indicators.
- Risk Management Insights: Predictive models highlight early warning signs of potential downturns or market fluctuations, enabling executives to take preemptive actions. With these insights, decision-makers can reallocate resources or adjust strategic priorities based on clear risk assessments.
- Scenario Analysis: By simulating different scenarios based on model outputs, consultants provide a range of possible outcomes. This approach allows executives to compare the impact of various strategic choices and select options that minimize risk while supporting growth.
- Actionable Recommendations: The predictive analytics process is paired with clear, actionable steps. This guidance helps executives implement changes that are directly tied to the analytical findings, ensuring that strategic decisions are both informed and measurable.
7. Customized Dashboards Aligned Directly with Executive Goals
Expert consultants collaborate closely with executives to design dashboards that address the specific metrics and targets critical to each leadership role. These dashboards are created after thorough discussions to pinpoint key performance indicators that align with strategic priorities such as profitability, cost management, market share, and operational performance. The resulting dashboards serve as focused tools, providing a clear visual summary of data trends and operational status, thereby enabling informed decision-making and timely business actions.
Key aspects of these customized dashboards include:
- Tailored Metrics: Dashboards are built with metrics selected to match the individual responsibilities of executives. This might include revenue figures, operational throughput, or customer satisfaction scores.
- Role-Specific Views: Different leaders require distinct insights. For example, financial executives may view detailed budget and expense reports, while operations leaders may concentrate on production and supply chain data.
- Real-Time Alerts: Custom dashboards can incorporate real-time monitoring, setting alerts for deviations from established thresholds. This feature enables immediate attention to issues as they arise.
- Visual Clarity: The dashboards employ clear and interactive visuals that simplify complex data sets, making it easier to grasp performance trends and identify areas needing intervention.
- Integration with Existing Data Sources: By connecting to current databases and systems, these dashboards guarantee that executives receive accurate and updated information without redundancies.
- Flexibility for Future Adjustments: As business needs shift, the dashboards are adaptable, allowing for modifications in metrics or layout to maintain alignment with evolving executive goals.
Consultants initiate the process by conducting detailed consultation sessions with key stakeholders. Through these sessions, they identify what data matters most and determine how to present it in a manner that supports swift decision-making. The dashboards are not merely static displays; they are interactive interfaces that allow executives to drill down into specific data points, compare historical trends with current performance, and quickly assess the impact of business decisions.
8. Improved Collaboration Across Leadership Teams
Consultants set up reporting systems that connect various departments, allowing leadership teams to review the same data in real time. This connection creates a shared environment where executives can discuss common metrics, make joint decisions, and address issues that cross departmental boundaries. When all leaders have access to a unified data view, the organization experiences fewer misunderstandings and quicker resolutions to operational challenges.
Key points include:
- Unified Reporting Environment: By linking multiple data sources, experts create a central repository where all key indicators are visible. This setup allows departments such as finance, operations, and sales to refer to identical metrics, reducing discrepancies and promoting a clear understanding of performance.
- Interactive Meeting Support: Custom dashboards are designed for interactive use during executive meetings. This feature facilitates real-time discussions, where data is reviewed collectively, and adjustments are made based on immediate insights.
- Consistent Data Definitions: Standardized metrics across the organization prevent misinterpretation. All teams work with the same definitions for key performance indicators, which minimizes confusion and aligns discussions around common goals.
- Collaborative Planning and Decision-Making: With shared data at hand, leaders can coordinate their plans more effectively. The system supports joint strategy sessions that address revenue drivers, operational bottlenecks, and customer engagement metrics, ultimately leading to more coordinated actions.
- Efficient Problem Resolution: The ability to access and review unified data in real time helps teams identify issues quickly. This common framework reduces the time taken to resolve problems, as cross-departmental feedback is immediate and based on a unified set of facts.
9. Measurable Return on Investment (ROI) in Analytics
Expert Power BI consultants focus on delivering clear, quantifiable benefits that directly impact the bottom line. They begin by establishing a detailed baseline of current reporting processes, costs, and operational metrics. This baseline serves as a reference point to measure improvements once new analytics systems are implemented.
Key elements include:
1. Baseline Analysis:
- Document current reporting methods, including manual data aggregation, error rates, and associated costs.
- Establish clear benchmarks to compare performance after the new system is in place.
2. Time and Cost Savings:
- Quantify the reduction in hours spent on data compilation and manual reporting.
- Measure direct cost savings resulting from decreased reliance on legacy systems and reduced IT support for routine tasks.
3. Performance Metrics:
- Identify key indicators such as forecasting accuracy, data consistency, and reporting turnaround time.
- Track improvements in these metrics to demonstrate direct operational benefits.
4. Quantifiable Business Impact:
- Provide case studies where similar implementations resulted in significant improvements, such as lower error rates and increased productivity.
- Detail specific examples, like a reduction in report generation time or a measurable increase in forecasting precision.
5. Ongoing Monitoring:
- Implement regular review processes to compare current performance against the established baseline.
- Use iterative feedback to adjust reporting tools and processes, ensuring that improvements remain aligned with business objectives.
10. Scalable Solutions That Grow with Your Business
Expert Power BI consultants design systems with a forward-thinking approach, constructing analytics platforms that are capable of handling increased demands as organizations expand. These solutions are built on a flexible foundation, accommodating higher data volumes, additional user roles, and more detailed reporting needs without requiring a complete system rebuild. The design process involves a careful evaluation of long-term business goals, ensuring that every component of the system is ready to adapt as the organization’s operational scope widens.
Key elements of these scalable solutions include:
1. Modular Architecture:
- The system is built with independent modules that can be added or adjusted over time.
- This design allows for the introduction of new data sources and reporting functions without interfering with existing components.
2. Flexible Data Integration:
- Systems are configured to connect with a wide range of internal and external data sources.
- As additional data streams emerge, they can be incorporated with minimal interruption to ongoing operations.
3. Efficient Resource Management:
- The framework supports an increasing number of users and more complex queries while keeping performance steady.
- This capability reduces the need for frequent hardware upgrades or software overhauls, keeping costs predictable.
4. Cost-Effective Expansion:
- Investments made during the initial setup continue to support growth, reducing the need for costly replacements or significant reconfigurations as business needs evolve.
- The scalable design means that incremental improvements and additions can be made without large-scale disruptions.
5. User-Centric Growth:
- Even as the system expands, it maintains a user-friendly interface that allows new and existing users to access the necessary information without extensive retraining.
- Consistent design principles help ensure that the platform remains intuitive, regardless of added complexity.
Conclusion
Our detailed discussion shows that expert Power BI consulting offers clear advantages for senior business leaders. The strategic application of these services leads to measurable improvements in decision-making, data consistency, and cost management. With the support of specialized consultants, enterprises can achieve reliable reporting, increased cross-department visibility, and more accurate predictive capabilities that contribute directly to better business outcomes.
Given these benefits, business leaders are encouraged to conduct a thorough evaluation of their current analytics setup. Identify gaps in data integration, reporting speed, and cost efficiency. Then, consider engaging expert Power BI consultants to refine and improve your data capabilities. Taking prompt action will not only improve current operations but also prepare your organization to meet new challenges effectively. Contact a trusted consulting partner to discuss how your business can achieve measurable improvements in analytics performance.
FAQs (Frequently Asked Question)
Power BI consulting involves experts designing and setting up data systems that combine information from various sources into one main dashboard. This setup gives leaders clear, real-time insights that reduce manual reporting and lower costs. It helps companies make quicker, informed decisions based on accurate data.
Consultants bring together multiple data sources into a single reporting framework. With one reliable reference point for all key metrics, discrepancies are minimized. This method assists teams in referring to the same information, supporting clear communication and precise planning based on solid data figures.
Yes, the dashboards created by Power BI consulting experts are made for ease of use. Their intuitive design lets business users view and interpret important data independently, reducing the need for constant IT assistance. This independence speeds up routine reporting tasks and supports effective decision-making.
By moving to a centralized, cloud-based reporting system, companies often experience lower licensing fees and reduced hardware expenses. The service cuts down on the need for extensive IT support through automated reporting tasks. Overall, this results in reduced operational costs and a more efficient reporting process.
Experts incorporate robust security measures by setting up role-based access and continuous monitoring. These practices lower data risks while meeting regulatory requirements. The result is a safer environment for sensitive business information that does not compromise the user experience.
Predictive analytics is a key component of these services. By applying statistical models to historical data, the system can point to upcoming trends and potential challenges. This information helps management prepare strategies ahead of time, relying on data trends and forecasts for better planning.
Customized dashboards focus on the specific metrics that matter most to each leadership role. They display real-time data and key figures in a simple format, making it easier for managers to assess business performance quickly. This focused view supports well-based decisions that address critical business needs.
By integrating various data sources into one accessible reporting platform, these services create a shared view of performance metrics. This common framework allows different departments to discuss and assess the same business information, which leads to aligned initiatives and coordinated actions across teams.

