

Section
Planning and Executing a Successful Power BI Implementation
Section
Section
- Strategic BI roadmap alignment: A structured Power BI Implementation guides CIOs and IT teams through planning—defining KPIs, securing executive sponsorship, and setting governance—to drive revenue growth, cost efficiency, and customer satisfaction.
- Unified data consolidation and integration: Effortlessly connect on-premises and cloud sources—CRM, ERP, or third-party APIs—using Power BI Integration and Dataflows, preserving data lineage and powering reliable Real-Time Data Analytics.
- Intuitive, user-focused dashboards: Use advanced Data Visualization Tools and follow Power BI Best Practices to create Power BI Dashboards that cater to analysts, managers, and executives, highlighting the metrics that matter most.
- AI-driven insights and real-time monitoring: Built-in anomaly detection, natural-language Q&A, and Azure ML integration extend visualization into predictive analytics, while automatic refresh keeps Power BI Reporting current.
- Scalable self-service with governance: Empower teams with governed self-service reporting backed by role-based access control, workspace management, and audit logging—and supported by VBeyond Digital’s expert implementation guidance.
Section
Data-driven organizations demand a clear roadmap for analytics success. A structured Power BI Implementation equips CIOs, CTOs, and IT Directors to eliminate data silos and speed up insight delivery. By aligning your BI strategy with strategic goals, securing executive sponsorship, and establishing governance for secure content publishing, you create the foundation for impactful Business Intelligence Solutions.
A disciplined planning phase makes sure each milestone advances your core objectives—whether that’s driving revenue growth, increasing operational efficiency, or improving customer experience. Clearly define how Power BI for Business will support these outcomes, from initial use cases to phased adoption.
Investing time up front to plan your Power BI Implementation lowers deployment risk, accelerates time to insight, and positions your teams to craft Interactive Dashboards and Real-Time Data Analytics with confidence.
This blog presents the complete Power BI for Business lifecycle. Whether you’re rolling out Real-Time Data Analytics or establishing governed self-service reporting, this consultative framework will help your organization deliver trusted Power BI Reporting with clarity and speed.
The Value of Power BI for Modern Businesses
A well-executed Power BI Implementation delivers a single source of truth, bringing clarity to complex data estates and enabling your teams to act on insights with confidence:
- Rapid data consolidation: Microsoft Power BI natively connects to hundreds of sources—on-premises and cloud—eliminating extended ETL cycles and enabling data consolidation in minutes.
- Interactive Dashboards: Its drag-and-drop canvas and built-in visual library empower users to create Power BI Dashboards without code, so stakeholders can explore trends, spot anomalies, and share interactive reports instantly.
- Seamless Power BI Integration: By integrating data from CRM, ERP, or third-party APIs, Power BI Integration preserves data lineage and keeps Real-Time Data Analytics pipelines both reliable and high performing.
- AI-Driven insights: Built-in capabilities—like anomaly detection, natural-language Q&A, and Azure ML integration—surface patterns and forecasts, extending visualization into predictive analytics.
- Governance and security: With role-based access control, row-level security, workspace management, and audit logging, Power BI Features enforce data protection policies, so IT leaders can trust every report’s integrity.
Section
Section
Plan your Power BI
implementation
Section
Why is Power BI Essential for Businesses?
Enterprises can no longer tolerate reporting delays or data silos. Power BI Implementation addresses critical pain points:
- Empowered self-service: Analysts and leaders can build, modify, and distribute Power BI Dashboards and reports without IT intervention, slashing delivery times from weeks to hours.
- Flexible analytics at scale: From in-memory models that handle millions of rows to Direct Query for live data, Power BI’s architecture supports diverse Power BI Use Cases—real-time telemetry or scheduled batch refresh.
- Collaborative insights: Embedded in Microsoft Teams and available on mobile, Interactive Dashboards ensure CIOs and CTOs always have up-to-date metrics at their fingertips.
- Consistent governance: Centralized workspace management and security controls prevent “shadow reporting,” promoting Power BI Best Practices across the organization.
Core Components and Functionalities of Power BI
A successful Power BI rollout depends on a comprehensive ecosystem of interconnected tools and services that handle every stage of your data analytics journey :
- Power BI Desktop: The Windows authoring tool combines Data Visualization Tools, a Query Editor for ETL, and a modeling environment to build datasets before publishing.
- Power BI Service: The SaaS platform (app.powerbi.com) hosts published reports and Interactive Dashboards, supports workspaces, Microsoft Teams embedding, and real-time collaboration.
- Power BI Mobile Apps: Native iOS, Android, and Windows apps provide on-the-go access to dashboards with touch-enabled drill-downs and KPI alerts.
- On-Premises Data Gateway: Securely links on-premises systems—SQL Server, SAP, file shares—to the service, handling credential encryption and automated refresh for Real-Time Data Analytics.
- Power BI Dataflows: Cloud-based ETL that ingests, cleans, and unifies data into the Common Data Model, enabling consistent downstream datasets.
- Power BI Embedded & REST APIs: SDKs and APIs let you embed reports and dashboards into custom applications, extending your Business Intelligence Solutions beyond the core platform.
- Power BI Report Server: An on-premises option matching cloud report rendering and scheduled refresh for organizations requiring data residency.
Assessing Your Business Needs
A thorough needs assessment lays the foundation for a successful Power BI Implementation. By evaluating your current data estate, user maturity, and reporting priorities, you ensure your roadmap addresses real pain points—reducing rework and accelerating time to value.
- Establish success criteria tied to business objectives (revenue, cost control, customer satisfaction).
- Determine IT investments in data pipelines, gateways, and capacity planning.
- Align on a governance framework that enforces Power BI Best Practices from day one.
We bring clarity and velocity to your digital initiatives by grounding every dashboard in measurable business outcomes.
Understanding the Scope of Power BI Implementation
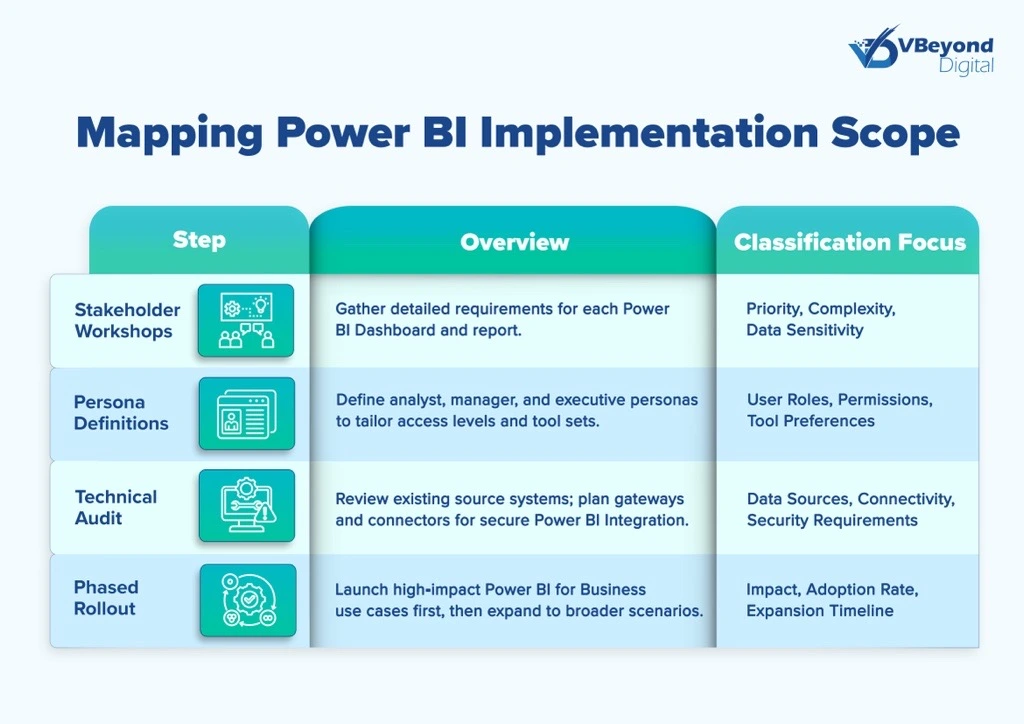
Defining scope prevents unchecked project growth. You can begin by mapping high-level use cases operational monitoring, executive scorecards—and classifying them by priority, complexity, and data sensitivity:
1. Stakeholder workshops to capture requirements for each Power BI Dashboard and report.
2. Persona definitions (analyst, manager, executive) to tailor access and tool sets.
3. Technical audit of source systems to plan necessary Power BI Integration (gateways, connectors).
4. Phased rollout starting with high-impact Power BI for Business use cases before expanding.
Identifying Data Visualization and Reporting Needs
Document your current reporting landscape, track how often different reports are actually being used, and spot where you’re missing critical insights. Then bring stakeholders together to figure out exactly which metrics, patterns, and red flags are most important for their specific roles and decisions. Then:
- Prioritize designs that deliver quick wins (top-5 value drivers).
- Select appropriate Power BI Features—custom visuals, drill-through, Dataflows—for each use case.
- Define performance targets for Real-Time Data Analytics and refresh schedules to meet SLAs.
Data Preparation and Integration
A solid data foundation underlies every successful Power BI rollout. When you take the time to clean, organize, and connect your data properly, your dashboards and reports become dependable, scale smoothly, and consistently hit your performance targets.
The Importance of Clean, Organized Data
Power BI Reporting accuracy hinges on high-quality source data. Inconsistent formats, duplicate records, or null values produce misleading visuals and erode trust. Power Query’s data profiling lets you resolve errors, standardize types, and shape tables before loading into a model. Proactively cleaning data—removing duplicates, replacing missing values, enforcing naming conventions—reduces model complexity and accelerates refresh times for every Interactive Dashboard.
Integrating Data Sources with Power BI
Seamless Power BI Integration unifies on-premises and cloud systems into a single analytics fabric. Deploy an On-Premises Data Gateway to connect SQL Server, SAP, and file shares securely to the Power BI Service. Leverage Dataflows for reusable ETL processes, ensuring consistent lineage and traceability across datasets. Whether ingesting ERP data through Direct Query or scheduled imports from Azure Synapse Analytics, a well-architected integration layer provides reliable Real-Time Data Analytics with minimal latency.
The Role of a Dedicated Implementation Partner
Partnering with a specialized Power BI Implementation partner accelerates deployment and embeds Power BI Best Practices. A partner brings expertise in dataset optimization, workspace architecture, and security policies, and introduces proven Power BI Use Cases to jump-start your analytics journey. They also lead change management—training teams on Data Visualization Tools, DAX, and report authoring—to foster self-service and sustainable adoption. With expert guidance on governance and performance tuning, transformation leaders can focus on interpreting insights, not troubleshooting infrastructure.
Designing Effective Dashboards and Reports
Creating dashboards and reports that actually connect with both C-level executives and front-line teams takes thoughtful design and smart interactive features. When you follow proven Power BI principles, you end up with content that people not only want to use but that actually helps them make better decisions and take meaningful action.
Best Practices for Dashboard Design
- Know your audience: Limit each Power BI Dashboard to the top 5–9 visuals that address specific stakeholder questions. Group related charts to guide the viewer’s eye.
- Choose appropriate visuals: Use bar/column charts for comparisons, line charts for trends, and gauges/cards for thresholds. Each visual should communicate one primary message.
- Maintain consistent styling: Apply a color-blind-friendly palette and uniform typography. Consistency in fonts, sizes, and labels reduces cognitive load.
- Optimize performance: Keep data models lean—use import mode with tailored filters, remove unused columns, and aggregate at the source. This accelerates load and refresh times.
- Provide clear context: Add descriptive titles, axis labels, and source annotations. Explicit context ensures viewers understand metric definitions, timeframes, and data recency at a glance.
Incorporating Interactivity and Drill-Down Features
- Cross-filtering and highlighting: Enable visuals to respond to user selections, empowering on-demand segment analysis.
- Drill-down and drill-up: Design hierarchical axes (e.g., Region → Country → City) so users can switch between strategic overviews and detailed views within the same visual.
- Slicers and filters pane: Use slicers or the filters pane for page-wide filters—accelerating self-service and reducing IT backlog.
- Bookmarks and tooltips: Capture narrative sequences with bookmarks and enrich Interactive Dashboards with custom tooltips that reveal details without cluttering the view.
- Real-time updates: For critical metrics, configure automatic page refresh or live connections so dashboards display up-to-the-minute data, driving trusted Real-Time Data Analytics.
Conclusion
For a modern business or large enterprise, data is the fulcrum of decision-making and strategic planning. From understanding the essence of Power BI to the intricacies of designing user-centric dashboards, it’s evident that a well-implemented Power BI solution can be a game-changer for businesses. Its versatility in integrating various data sources, coupled with its powerful visualization capabilities, makes it an invaluable asset for organizations, regardless of size. Whether you’re a growing business or an established enterprise, Power BI offers a scalable solution that can adapt and grow with your business needs, ensuring you’re always at the forefront of data-driven decision-making.
VBeyond Digital offers extensive support to organizations looking to leverage Power BI to its fullest potential. Recognizing that each business is unique, VBeyond Digital delves deep into understanding the intricacies of your operations. This holistic approach ensures that Power BI isn’t just implemented but is tailored to match your business objectives. With a dedicated partner like VBeyond Digital, organizations can be confident in not only deploying Power BI but in maximizing its advantages, ensuring a future where data is not just viewed but truly understood and utilized for transformative growth.
FAQs (Frequently Asked Question)
Power BI implementation refers to the structured process of adopting Microsoft Power BI as a core Business Intelligence Solution within an organization, covering planning, deployment, and user enablement. A robust implementation plan addresses strategy, governance, workspace architecture, data modeling, security policies, and change management to align dashboards and reports with business priorities.
Power BI is important for businesses because it consolidates data from disparate sources into Interactive Dashboards, enabling Real-Time Data Analytics that drive faster, data-driven decisions. Its AI-driven features like anomaly detection and natural-language Q&A extend visualization into predictive analytics, while governed self-service reporting and enterprise-grade security uphold compliance and scalability.
To start with Power BI implementation, begin by defining a BI strategy that aligns with your organization’s objectives and success criteria for Power BI Reporting. Next, set up your environment: create workspaces in the Power BI Service, configure On-Premises Data Gateways for secure data connections, and assign licenses to users. Finally, prioritize initial Power BI Use Cases—such as operational monitoring or executive scorecards—and execute a phased rollout with governance policies, training on Data Visualization Tools, and performance tracking.
Power BI can indeed be used by small businesses, offering cost-effective licensing tiers and user-friendly interfaces that require minimal IT overhead. Prebuilt connectors and intuitive Data Visualization Tools allow small teams to build reports and Interactive Dashboards quickly, while the platform’s modular architecture scales with growing data volumes and complexity.
Power BI’s core components include Power BI Desktop for authoring, the Power BI Service for publishing and collaboration, and mobile apps for on-the-go access. Supplementary elements—Power Query and Power Pivot for data transformation and modeling, On-Premises Data Gateways for secure integration, Power BI Dataflows for reusable ETL, and Power BI Embedded and REST APIs for in-app analytics—support comprehensive Real-Time Data Analytics and Interactive Dashboards

