

Trading Cloud Cost Chaos for FinOps Clarity with Azure + Power BI
Section
- Azure Cost Management supports organizations with tracking spending, budgeting alerts, and anomaly detection across subscriptions and billing scopes.
- Adopting rolling forecast cadences and Power BI FinOps toolkits speeds up financial planning and chargeback accuracy.
- Applying the FOCUS schema and ADLS Gen2 storage delivers consistent, automatable cost data pipelines.
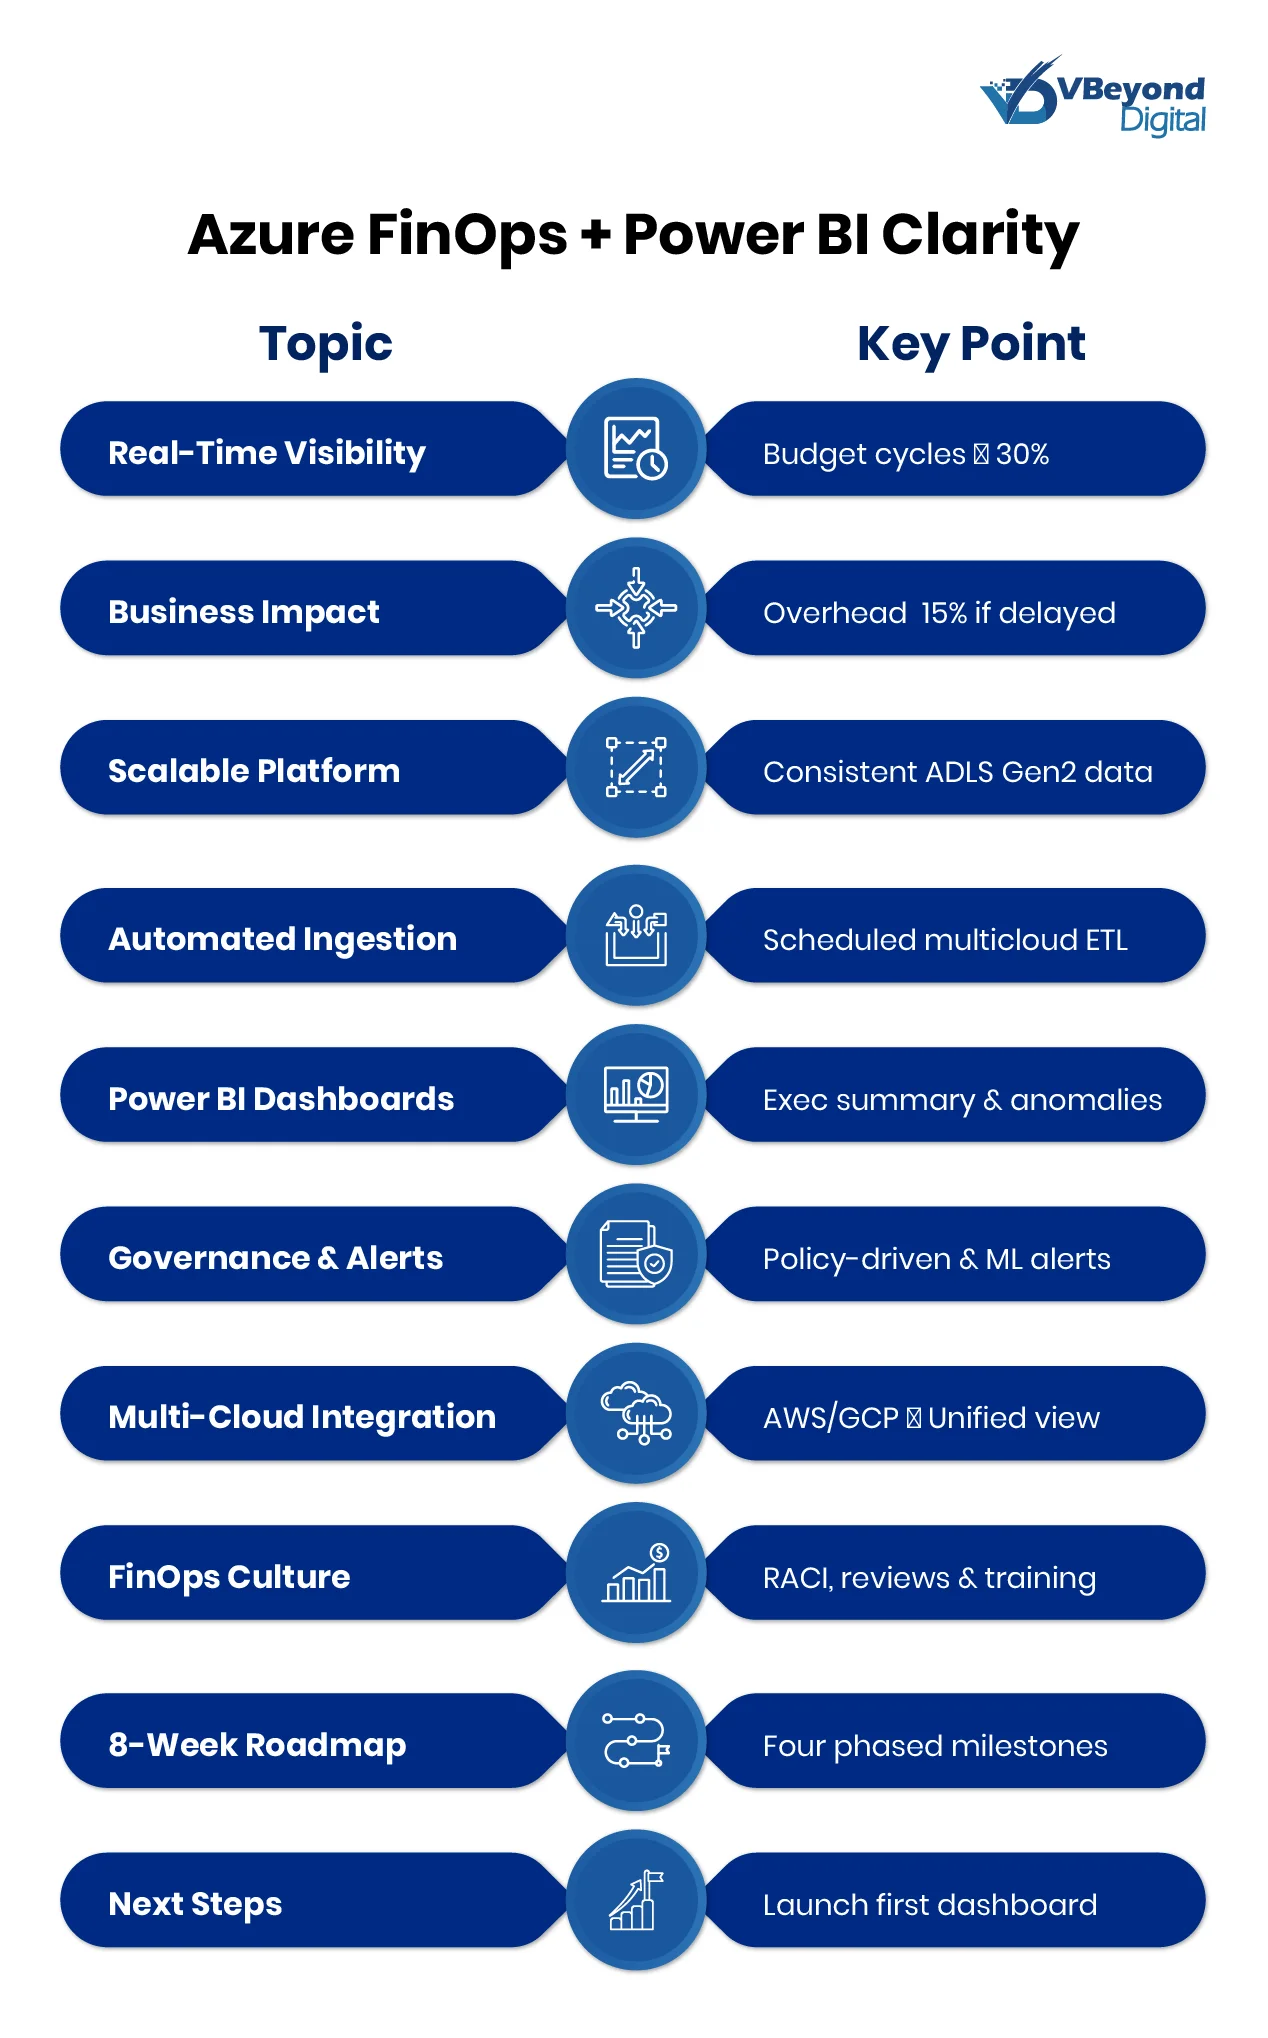
- An eight-week deployment plan, from export setup to multicloud ingestion, automated policy alerts, and executive dashboards, builds shared cost responsibility.
Azure Cost Management provides a unified portal for consumption data, budgets, forecasts, and anomaly detection that gives CIOs and CTOs granular visibility into resource-level spend across subscriptions, management groups, and billing scopes.
Cost monitoring in Azure extends beyond end-of-month invoices to continuous tracking of usage across services, regions, subscriptions, and resource groups. Built-in budget and alert capabilities let teams trigger notifications via Azure Budgets and Logic Apps when spend approaches predefined thresholds.
FinOps best practices emphasize collaborative budget management and forecasting workflows that increase predictability and financial control across the organization. By adopting rolling forecast cadences shifting from quarterly or annual plans to more frequent budgeting iterations, organizations can shorten planning cycles and make cost decisions within days.
Additionally, many teams harness Power BI-based FinOps toolkits to automate spend analysis, correlate usage patterns with budget thresholds, and accelerate chargeback and forecasting accuracy. Policy-driven enforcement through Azure Policy and automated workflows further reduce manual governance overhead, ensuring consistent cost controls at scale.
Key challenge: Fragmented billing APIs, siloed exports, and manual assembly
Historically, Azure exposed enterprise billing data via legacy Enterprise Agreement (EA) APIs secured by API keys, while the newer Microsoft Customer Agreement (MCA) uses Microsoft Entra authenticated Cost Management APIs. During EA-to-MCA migrations, inconsistent data schemas and retired EA reporting endpoints can lead to gaps in cost visibility and duplicated engineering efforts.
Export jobs, whether scheduled daily, weekly, or monthly, produce JSON or CSV files in varying schemas, forcing FinOps teams to reconcile and merge datasets manually. These manual workflows introduce latency, increase error risk, and undermine IT Directors’ ability to enforce accurate chargeback models and govern cloud spending effectively. Whenever you rely on spreadsheets and ad-hoc scripts instead of integrated dashboards and automated pipelines, budget accuracy and agility suffer from stalling strategic initiatives and exposing the organization to uncontrolled cost variance.
Start your journey to Azure FinOps
The Business Imperative for FinOps Clarity
Building a FinOps framework with Azure Cost Management is the foundation for cloud cost control and strategic budget alignment.
A. Impact on Digital Initiatives
In modern digital initiatives, delayed cost insights have a direct impact on the time-to-market. According to the Flexera 2025 State of the Cloud Report, organizations reported that their cloud budgets exceeded limits by an average of 17%.
Without an Azure cost dashboard built on Power BI, teams spend hours generating ad-hoc reports, reducing time for strategic tasks, and inflating administrative overhead, corporate product development can be set back when cloud costs are not adequately managed, as waste masks true resource availability. Introducing a FinOps framework with real-time telemetry reduces time-to-insight, aligning budgets with sprint cycles and accelerating product deployment cycles.
B. Executive Accountability
Cloud financial operations hinge on clear cost ownership, yet 87% of companies cannot pinpoint who owns specific portions of cloud spend. A FinOps framework automates Azure cost analysis and allocates 100% of cloud spend accurately, enabling audit-ready reporting within minutes.
Embedding chargeback models into Azure governance policies drives accountability, as engineering and finance teams share responsibility for spending forecasts and budget adherence. Open communication and transparent forecasting tracking actuals against budget in real time helps identify early anomalies and prevents escalations across teams. By formalizing FinOps best practices into regular reviews and alerts, organizations reduce cost disputes and build a culture of shared accountability across C-level and technical teams.
As the FinOps Foundation defines, embedding financial accountability into every cloud decision-making process turns cost control into a collective business objective rather than a technical afterthought.
Building and Deploying a Scalable Data Platform
Before diving into the export, storage, and migration best practices, this section lays out how to build a scalable data platform that standardizes billing exports with FOCUS, leverages Azure data lake storage gen2 for efficient cost data querying, and ensures seamless EA-to-MCA migration to maintain cloud cost control and Azure cost analysis pipelines.
A. Standardizing Exports with FOCUS
A FinOps framework relies on a consistent billing schema to drive accurate cost allocation, budgeting, and forecasting across teams. The FinOps Open Cost and Usage Specification (FOCUS) defines a common data structure covering dimensions, metrics, and metadata so that every export aligns with the same taxonomy for cost control workflows. By exporting Azure Cost Management data as FOCUS-compliant Parquet files, you eliminate time spent mapping JSON and CSV payloads into Power BI Dashboards, accelerating your cloud cost optimization analysis.
Azure’s improved exports now support the FOCUS open cost and usage spec by combining actual and amortized costs into a single dataset and trimming ingestion time and storage fees by up to 30 percent. You can extend FOCUS-aligned datasets with custom columns such as tag-based cost centers or project codes while preserving core schema requirements for chargeback and variance reporting. Export jobs are fully automatable via Microsoft Cost Management/exports ARM resource, where you configure overwrite behavior and compression settings to guarantee nightly consistency.
B. Storage Architecture in ADLS Gen2
Azure Data Lake Storage Gen2 adds a hierarchical namespace to object storage, giving file system–style semantics that accelerate cost data queries and scalability for large billing datasets. This namespace supports POSIX-style access control lists, so you can lock down export containers at folder or file level critical for audit-grade multicloud cost management. Organizing ingested exports into folders by subscription, resource group, and billing month simplifies Azure cost analysis and enables parallel Power BI report refreshes without manual folder reconciliation.
Namespace-enabled metadata operations, like folder renames and directory listings execute in milliseconds, cutting both compute time and transaction charges when orchestrating frequent ingestion pipelines. Storage tiers and lifecycle rules can also be applied at the folder level, ensuring infrequently accessed historical exports move automatically to cool or archive tiers, reducing overall storage outlay.
C. EA to MCA Migration
Migrating from an Enterprise Agreement (EA) to a Microsoft Customer Agreement (MCA) change how you authenticate and fetch cost data, so scripts and pipelines must be updated to call the new Cost Management Cost Details API with Microsoft Entra credentials. Under EA, usage details came through legacy endpoints secured by static API keys; MCA replaces these with role-based access via Azure Active Directory tokens, improving security posture for your Azure Cost Management workflows.
As EA reporting APIs are phased out, early MCA migration guarantees uninterrupted FOCUS-compliant exports and access to the latest Cost and Usage Specification datasets. New export definitions in MCA let you choose between actual, amortized, or combined cost datasets optimizing your Azure cost dashboard for either raw usage patterns or blended financial views. Typical migration steps include verifying the new billing account scope hierarchy, reconfiguring export storage targets, updating role assignments to align with Azure governance policies, and validating subscription mappings post-transition.
Ingesting Data with Azure Native Tools
A solid ingestion pipeline through Cost Management exports and Data Factory feeds normalized cost data into your FinOps framework, keeping Power BI dashboards current with minimal lag.
A. FinOps Toolkit with Power BI Reports
The Azure FinOps toolkit for Power BI delivers five prebuilt PBIT templates Cost Summary, Rate Optimization, Cloud Policy and Governance, Workload Optimization, and Data Ingestion to accelerate cloud cost control reporting. The Cost Summary report provides an overview of amortized and actual spend across services, enabling rapid identification of the highest-impact cost drivers in your Azure cost dashboard. The Rate Optimization report outlines current reservation coverage, potential savings from reserved instances, and commitment discounts to guide cloud cost optimization decisions.
The Cloud Policy and Governance report surfaces compliance gaps, tag hygiene, and policy adherence metrics, reinforcing Azure governance policies across subscriptions. The Workload Optimization report analyzes resource utilization patterns and highlights idle or underutilized workloads to enforce FinOps best practices. Finally, the Data Ingestion report verifies completeness and freshness of ingested cost exports, ensuring your Power BI Dashboards reflect accurate Azure cost analysis.
B. Cost Management Template App (EA)
The Cost Management template app for Enterprise Agreement accounts provides a turnkey solution for Azure Cost Management reporting on Power BI by importing cost and usage data into preconfigured dashboards. Installation requires selecting your billing scope in the Azure portal and authenticating via EA credentials, after which the app provisions analytics covering spend trends, usage patterns, and savings insights. Teams can then migrate from the out-of-the-box template to the Azure FinOps toolkit PBIT templates for deeper analytics aligned to internal reporting frameworks. Customizing the default dashboards with additional data sources and enterprise metadata refines the Azure cost dashboard to meet governance and chargeback requirements.
C. Data Factory Pipelines
Azure Data Factory supports multicloud cost management by automating the ingestion of AWS and Google Cloud billing exports into Azure Data Lake Storage Gen2 for centralized processing. With built-in connectors for Amazon S3 and Google Cloud Storage, pipelines can fetch daily export files, convert them to Parquet, and land them in dedicated ADLS Gen2 containers for efficient Azure cost analysis. Data Factory mapping data flows or copy activities enable schema normalization against FOCUS standards, removing manual scripting and reducing pipeline maintenance overhead.
By coupling Data Factory triggers with monitoring alerts, organizations enforce FinOps best practices through automated pipelines that generate updated Power BI Dashboards as soon as new cost data arrives. Incorporating incremental load techniques and partitioned storage in Azure data lake storage gen2 optimizes pipeline performance and storage costs while maintaining data freshness for real-time cost control insights.
Designing Outcome-Led Power BI Dashboards
A. Executive Summary Page
An Executive Summary Page consolidates critical cost metrics for total spend, forecast versus actual trends, and variance alerts into a single view for C-level review.
Using the Azure Cost Management connector in Power BI Desktop, teams pull consumption data directly into visuals that update with each dataset refresh.
Applying dashboard design best practices for prominent KPI cards, sparing use of color, and clean layout ensures the most essential information stands out for quick interpretation.
Embedding FinOps framework metrics like budget adherence and rolling forecast accuracy helps IT Directors maintain cloud cost control without manual report assembly.
B. Cost Drivers & Anomalies
Cost Drivers & Anomalies visuals surface service-level spend breakdowns and use Azure Cost Management’s anomaly detection to flag unexpected charges.
Power BI’s built-in anomaly detection visual can overlay expected ranges and highlight outliers in time-series data, enabling rapid investigation of cost spikes.
Teams can integrate Azure Monitor alerts into their dashboards—pushing notifications through Logic Apps when costs deviate from forecast thresholds—to close the loop on cloud cost optimization workflows.
Linking anomaly context with resource tags and project codes via the FinOps toolkit Power BI reports enriches cost analysis and accelerates governance reviews.
C. Reservation & Commitment Analysis
Reservation & Commitment Analysis pages focus on reserved instance (RI) and savings plan utilization, showing coverage ratios and churn recommendations.
Amortized cost visuals display the effective daily price of reservations, helping product heads balance RI size against consumption patterns.
Interactive slicers allow teams to segment reservation data by subscription, region, or workload, driving targeted Cloud cost optimization initiatives without manual spreadsheet reconciliation.
D. Chargeback & Tagging Compliance
Chargeback & Tagging Compliance reports enforce Azure governance policies by tracking tag hygiene, policy compliance, and cost-center allocations.
Defender for Cloud’s chargeback feature integrates with Azure Cost Analysis to generate departmental chargeback statements based on billing tags, fostering transparent FinOps culture.
FinOps best practices recommend automating invoicing and chargeback report generation triggered by new exports to ensure teams receive audit-ready cost allocation details on schedule.
Embedding these reports in Power BI Dashboards empowers finance and engineering leaders to review and approve cost allocations collaboratively, making cloud cost control an organization-wide priority.
Implementation Roadmap
Week 1-2 | Enable Cost Management to exports & set up ADLS Gen2
- Configure daily or monthly exports of Cost and Usage details (actual, amortized, FOCUS) to an Azure Data Lake Storage Gen2 account with hierarchical namespace enabled.
- Create a StorageV2 account, enable Data Lake Storage Gen2, and apply proper IAM roles (Storage Blob Data Reader for reporting workloads).
- Organize export containers into folders by subscription and billing period to simplify ingestion and governance.
Week 3 – 4 | Deploy FinOps PBITs & Cost Management app; validate data flows
- Install the Cost Management Power BI template app for Enterprise Agreement scopes, then plan migration to FinOps toolkit templates for richer analytics.
- Download and connect the five FinOps toolkits Power BI. PBIT templates—Cost Summary, Rate Optimization, Governance, Workload Efficiency, Data Ingestion—to your ADLS Gen2 exports using a SAS token or service principle.
- Perform end-to-end validation: refresh datasets, verify completeness against the raw export files, and confirm that key visuals in your Azure cost dashboard populate correctly.
Week 5 – 6 | Integrate multicloud exports via Data Factory; refine dashboards
- Build Azure Data Factory pipelines to ingest AWS and GCP billing exports into the same ADLS Gen2 hierarchy, converting CSV/JSON to Parquet and applying FOCUS schema normalization.
- Partition data by date and subscription to optimize query performance and reduce costs with incremental loads in Azure data lake storage gen2.
- Update Power BI Dashboards to include cross-cloud spend comparisons, reservation analysis, and tag-based chargeback views for unified cloud cost optimization reporting.
Week 7 – 8 | Automate governance, train teams, and establish recurring FinOps reviews
- Automated budget creation and policy-driven alerts using the Budgets API, Azure Monitor action groups, and Logic Apps to enforce Azure governance policies upon threshold breaches.
- Develop runbooks and Logic App workflows to remediate non-compliant resources or notify stakeholders when budgets exceed defined limits.
- Schedule monthly “Cost Command Center” reviews with automated KPI exports from Azure Cost Management onto Power BI dashboards, covering Forecast Accuracy, Reserved Coverage, and Tag Compliance Rate.
- Conduct hands-on workshops and certify team members on FinOps best practices and Azure cost analysis techniques; embed micro-learning modules in CI/CD pipelines for ongoing adoption.
Conclusion
Adopting an Azure FinOps-driven approach to cloud cost control turns fragmented billing data into actionable insights, accelerating budgeting cycles and reducing governance overhead by automating export, reporting, and policy enforcement. By following this eight-week roadmap, CIOs and IT Directors establish a repeatable FinOps framework—from initial data exports through multicloud integration and automated governance—culminating in a sustainable FinOps culture where cost accountability is embedded across teams. The result is predictable budgets, rapid chargeback accuracy, and continuous improvement in Azure Cost Management, empowering technology leaders to focus on strategic initiatives rather than reactive spend firefighting.
Get in touch with VBeyond Digital to kick off your Azure FinOps transformation and take control of your cloud spend today.
FAQs (Frequently Asked Question)
Azure Cost Management is a unified portal that collects consumption data, budgets, forecasts, and anomaly alerts. It lets you monitor resource-level spending across subscriptions, resource groups, and management groups. Built-in budgets and alerts integrate with Logic Apps for threshold notifications, enabling continuous cost tracking instead of relying on end-of-month invoices.
Effective FinOps budgeting uses rolling forecasts to update plans more frequently than quarterly or annual cycles. Teams collaborate by assigning budget ownership to individual business units, triggering notifications when spending near thresholds. This approach shortens planning cycles and embeds financial accountability across technical and finance teams.
The Azure FinOps toolkit for Power BI provides prebuilt report templates, such as Cost Summary, Rate Optimization, and Data Ingestion, that connect directly to ADLS Gen2 datasets. Power BI connects via Azure Data Explorer or the Cost Management connector to automate spend analysis, correlate usage with budget thresholds, and accelerate chargeback reporting.
Migrating from an Enterprise Agreement (EA) to a Microsoft Customer Agreement (MCA) requires updating scripts to call the new Cost Management APIs authenticated via Azure AD tokens instead of static API keys. Teams must verify billing account scopes, reconfigure export definitions, update role assignments, and validate subscription mappings to maintain uninterrupted, compliant exports.
Azure Data Lake Storage Gen2’s hierarchical namespace offers file-system semantics that accelerate query performance and folder-level lifecycle rules for cost data storage. It also supports POSIX-style access control lists (ACLs), enabling granular permissions on directories and files for audit-grade governance and parallel Power BI report refreshes.

